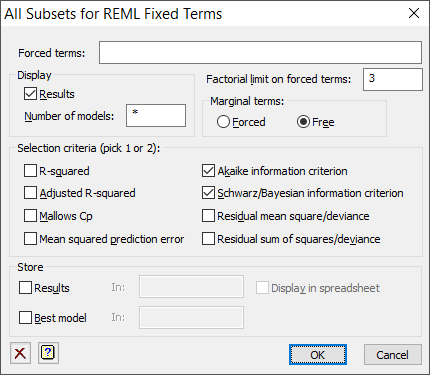
Use this to search through all sub-models for the Fixed model of the Linear Mixed Model (REML) menus. This uses the VALLSUBSETS procedure to fit all subsets of the fixed model and then 1 or 2 selection criteria to select the best model. This is accessed from the Linear Mixed Model Further Output dialog.

Forced terms
It is sometimes desirable to include specific terms in every model. Such terms may be specified by in this box, which may be set using a model formula or using a list of terms separated by commas.
Factorial limit on forced terms
You can control the factorial limit on model terms to be generated when you use model-formula operators like ‘*’.
Number of models
This specifies the number of models to print, sorted on the selection criteria. For example, if this was 5, only the 5 top models would be printed. If this is set to missing, *, then all models are printed.
Marginal terms
How to treat terms that are marginal to other terms.
| Forced | Terms that are marginal to another fixed term are treated as forced |
| Free | Terms that are marginal to another fixed term are retained in the “free” terms that are used to form the subsets |
Selection criteria
Specifies the model selection criteria used to pick the best models. You may select 1 or 2 or these criteria.
| R-squared | % sum of squares accounted for (taking the total sum of squares as the residual from the forced model) = 100 × [1 – Dev / Dev0] |
| Adjusted R-squared | % variance accounted for (compared to the residual mean square from the forced model) = 100 × [1 – (Dev / (n-p)) / (Dev0 / (n-p0))] |
| Mallows Cp | Mallows Cp = Dev / f + 2 × p – n |
| Mean squared prediction error | Mean squared prediction error = Dev × (n+1) × (n-2) / [n × (n-p) × (n-p-1)] |
| Akaike information criterion | Akaike information criterion = Dev / f + 2 × p |
| Schwarz/Bayesian information criterion | Schwarz or Bayesian information criterion = Dev / f + Ln(n) × p |
| Residual mean square/deviance | Residual mean square or deviance = Dev / (n-p) |
| Residual sum of squares/deviance | Residual sum of squares or deviance = Dev |
where Dev is the deviance or residual sums of squares of the current model, Dev0 is the deviance or residual sums of squares of the null model, p is the number of fitted parameters of the current model, p0 is the number of fitted parameters of the null model, n is the number of units and f is the dispersion parameter.
Store
Use these fields to save results from the all subsets analysis in Genstat data structures. After selecting the appropriate boxes, type the identifiers of the data structures into the corresponding In: fields.
| Results | Pointer | Pointer to save variates and scalars containing the criteria for the sets, and F and Wald statistics for the terms that they contain |
| Best model | Pointer | Pointer to formula of the best models according to the selected criteria |
Display in spreadsheet
Select this to display the results in a new spreadsheet window. Note as the best model contains formulae, it is not displayed in a spreadsheet. The results are displayed on two pages as some are vectors and some are scalars.
See also
- Linear Mixed Models Further Output for obtaining additional output after fitting a REML model.
- All Subsets Regression – Linear Models for model selection for Linear Models.
- All Subsets Regression – Generalized Linear Models for model selection for Generalized Linear Models.
- Linear Mixed Models (REML) menu.
- Repeated Measures – Data in single variate
- Repeated Measures – Data in Parallel
- Random Coefficient Regression
- Spatial Model – Regular Grid menu.
- Spatial Model – Irregular Grid menu.
- Automatic Analysis of Incomplete-Block Design menu.
- Automatic Analysis of Row-Column Design menu.
- Automatic Analysis of Series of Trials menu.
- VALLSUBSETS procedure to fit all fixed models.