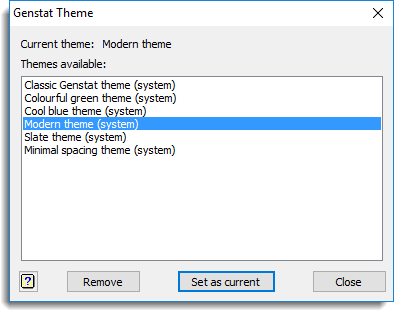
The first time you run Genstat you will be prompted to set the look and feel of spreadsheets and other client windows by selecting one of the standard colour Themes. You can also select a Graphics Environment to set the colours, styles and symbols, etc., for graphical plots.

Select initial theme
Select the theme you wish to use from the dropdown list. You can view the standard themes here.
Select initial graphics environment
Select the graphics environment you wish to use from the dropdown list. You can view the standard graphics environments here.
Changing your selections
The Select Initial Genstat Environment prompt will only appear the first time you run Genstat, but you can change your selections at any time.
To change your theme select Tools | Themes | Select, choose a different theme and click Set as current.

To change your graphics environment select Tools | Graphics environments, choose a different environment and click Set as current.

Creating your own theme
You can create your own themes by selecting Tools | Options then clicking the Fonts and colours tab or by selecting Tools | Spreadsheet Options then clicking the Appearance tab. After making changes you can save your settings as a new theme by selecting Tools | Themes | Save.
Creating your own graphics environment
To create your own graphics environment select Tools | Graphics environments, then click New. This lets you select your own axis, key, grid, frame, outline and symbol settings.
See also
- Standard Themes
- Standard Graphics Environments
- Tools menu
- Setting Options
- Setting Spreadsheet options
- Selecting a theme
- Saving a theme
- Graphics Environment menu
- Graphics Environment – Axis tab
- Graphics Environment – Key tab
- Graphics Environment – Grid tab
- Graphics Environment – Frame tab
- Graphics Environment – Outlines tab
- Graphics Environment – Symbols tab
- Setting fonts and colours
- Setting spreadsheet appearance