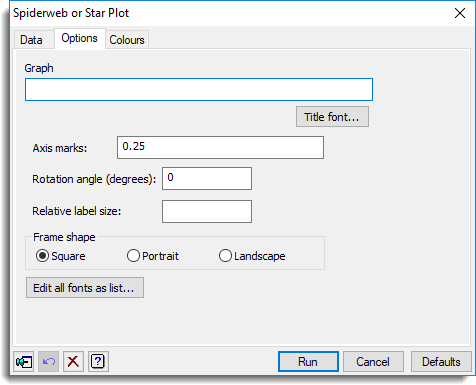
Use this to set attributes to control the appearance of a spider or star plot.

Graph title
Lets you specify a title for the plot. The title appears centred at the top of the graph.
Title font
This opens the Edit Font menu that lets you control the font for the title.
Axis marks
If this is a single value, this controls how far apart the marks on the axis are. If more than one value is given, then this gives the location on the axis of each mark. The locations are given as a relative value between 0 ands 1, where 1 is the maximum value on that axis.
Rotation angle (degrees)
This gives the angle in degrees to rotate the axis giving the first group. Setting this allows you to control which group is placed at the top of the graph. This must be between -180 and 360.
Relative label size
This controls the size of the labels on each axis. A value of 1 gives the default size. The font size of the labels are multiplied by this value to shrink or expand the labels. A value of 0 will remove the labels.
Frame shape
These options control the size of the frame for the plots on a single page. The individual graphs are square, but the layout of the multiple plots on a page may use this to add extra plots to fill a landscape or portrait page.
| Square | The frame is square. |
| Portrait | The frame fills a portrait oriented page. |
| Landscape | The frame fills a lansdcape oriented page. |
Action buttons
| Run | Produce the graph. |
| Cancel | Close the dialog without further changes. |
| Defaults | Reset the options to their default settings. |
Action Icons
| Pin | Controls whether to keep the dialog open when you click Run. When the pin is down |
|
| Restore | Restore names into edit fields and default settings. | |
| Clear | Clear all fields and list boxes. | |
| Help | Open the Help topic for this dialog. |
See also
Data tab for this dialog
Colours tab for this dialog
Edit font dialog
DSPIDERWEB procedure
DTABLE procedure